Publication-ready study-site maps
plot_sites.Rdplot_sites() draws sampling locations for a manuscript figure: points
from an sf table or longitude/latitude columns, optional grouping as
colour and shape, non-overlapping labels, an optional raster or coastline
backdrop, faceting, a simple scale bar and a north arrow. The result is a
ggplot object, so further layers can be added. Diversity values mapped as
a continuous fill still use plot_geo(); this verb is for the study-site
map that papers usually need first.
The Mt Wilhelm ant data (tidydiversity::png_ants) come with published bait GPS
positions in png_ants_sites; geo_example_sites() returns them as one
point per elevation band, ready to join by site.
SDM tools such as biomod2 and Maxent are out of scope here; they can be rebuilt later as tidy verbs.
Usage
plot_sites(
  data,
  lon = lon,
  lat = lat,
  colour = NULL,
  shape = NULL,
  label = NULL,
  facet = NULL,
  basemap = "esri",
  raster = NULL,
  coastline = NULL,
  occurrence = NULL,
  size = 3.2,
  occurrence_size = 1.4,
  scale_bar = TRUE,
  north_arrow = TRUE,
  scale_bar_km = NULL,
  scale_units = c("metric", "imperial", "both"),
  palette = c("okabe_ito", "grey"),
  legend_title = NULL,
  legend_position = "auto",
  legend_frame = TRUE,
  inset = FALSE,
  admin = NULL,
  admin_level = 1,
  admin_fill = FALSE
)
Arguments
- data
A data frame of sites (or occurrence records) with coordinates, or an
sfobject.- lon, lat
<
data-masking> Coordinate columns whendatais notsf.- colour, shape
<
data-masking> Optional grouping columns (habitat, elevation band, forest type, season).- label
<
data-masking> Optional site labels; overplotting is avoided with ggrepel when installed.- facet
<
data-masking> Optional column to facet by (taxon, season).- basemap
Basemap for the figure:
"none","coast","osm","carto","carto_dark","esri", aSpatRaster, or a file path. Seegeo_basemap(). Online tiles fall back to"coast"offline.- raster
Optional
terra::SpatRasteror file path used as an elevation / climate backdrop (same as passing that object tobasemap). Ignored whenbasemapis not"none".- coastline
Optional
sflines or polygons (for example a country outline) drawn under the sites when using a coast basemap.- occurrence
Optional second data frame of species records with the same coordinate columns, drawn as smaller points underneath the sites.
- size
Point size, or a bare column name mapped to point size (combined with
colourwhen both are set, like tmap size + col).- occurrence_size
Point size for occurrence records.
- scale_bar, north_arrow
Draw a scale bar and north arrow?
TRUEuses the default style,FALSEnone, or name a style: scale bars"pill","checker","line","ruler"; north arrows"needle","compass","rose","minimal"(seeannotation_scale_bar()).- scale_bar_km
Length of the scale bar in kilometres. When
NULL, a round length is chosen from the map extent (true metres via a local UTM projection when the map CRS is geographic).- scale_units
Scale bar units:
"metric","imperial"or"both".- palette
Discrete palette:
"okabe_ito"or"grey".- legend_title
Optional legend title (defaults to the colour column).
- legend_position
"auto"(collision-aware inside corner),"outside", or a corner"bl"/"br"/"tl"/"tr".- legend_frame
Draw a frame around an inside legend?
- inset
Overview / locator map:
FALSE,TRUE/"auto","png"(Papua New Guinea), or a length-4 bboxc(xmin, ymin, xmax, ymax). Placed in a free corner that does not overlap sites, the scale bar, north arrow or inside legend. When GADM data are cached, the PNG inset uses province boundaries fromgeo_gadm().- admin
Optional administrative boundaries: an
sfobject (for example fromgeo_gadm()), or an ISO3 country code that is fetched withgeo_gadm(admin, level = admin_level). Drawn as borders, or filled by province whenadmin_fillisTRUE.- admin_level
GADM level used when
adminis a country code (0country,1province,2district).- admin_fill
Fill administrative polygons (province choropleth colours) instead of outline-only borders.
Value
A ggplot object. Attribute tmr_decoration holds the reserved
corner boxes (for tests and debugging).
Examples
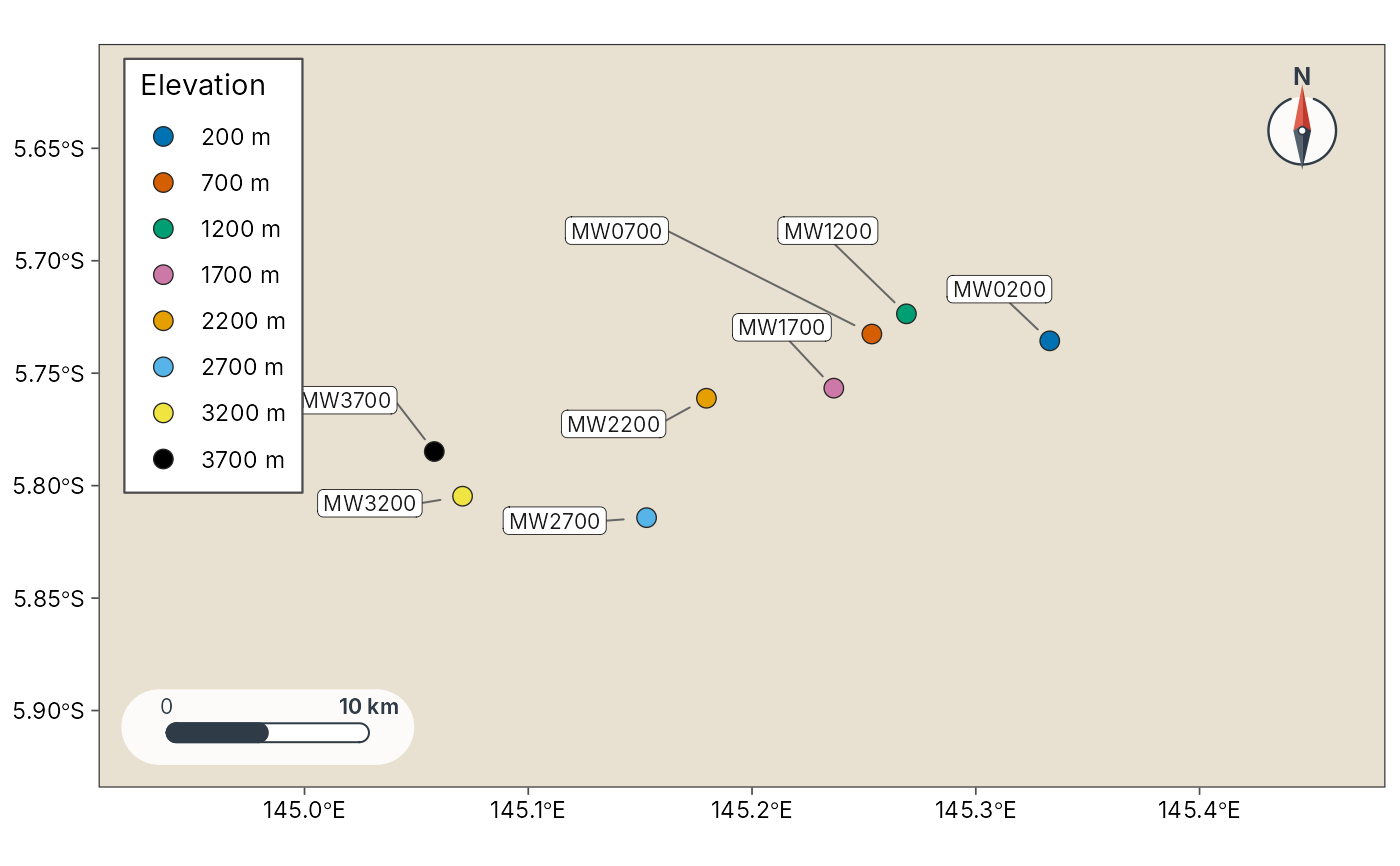
sites <- geo_example_sites("wilhelm")
plot_sites(sites, lon, lat, colour = elevation_band, label = site,
basemap = "coast")
 # Facet by a grouping column
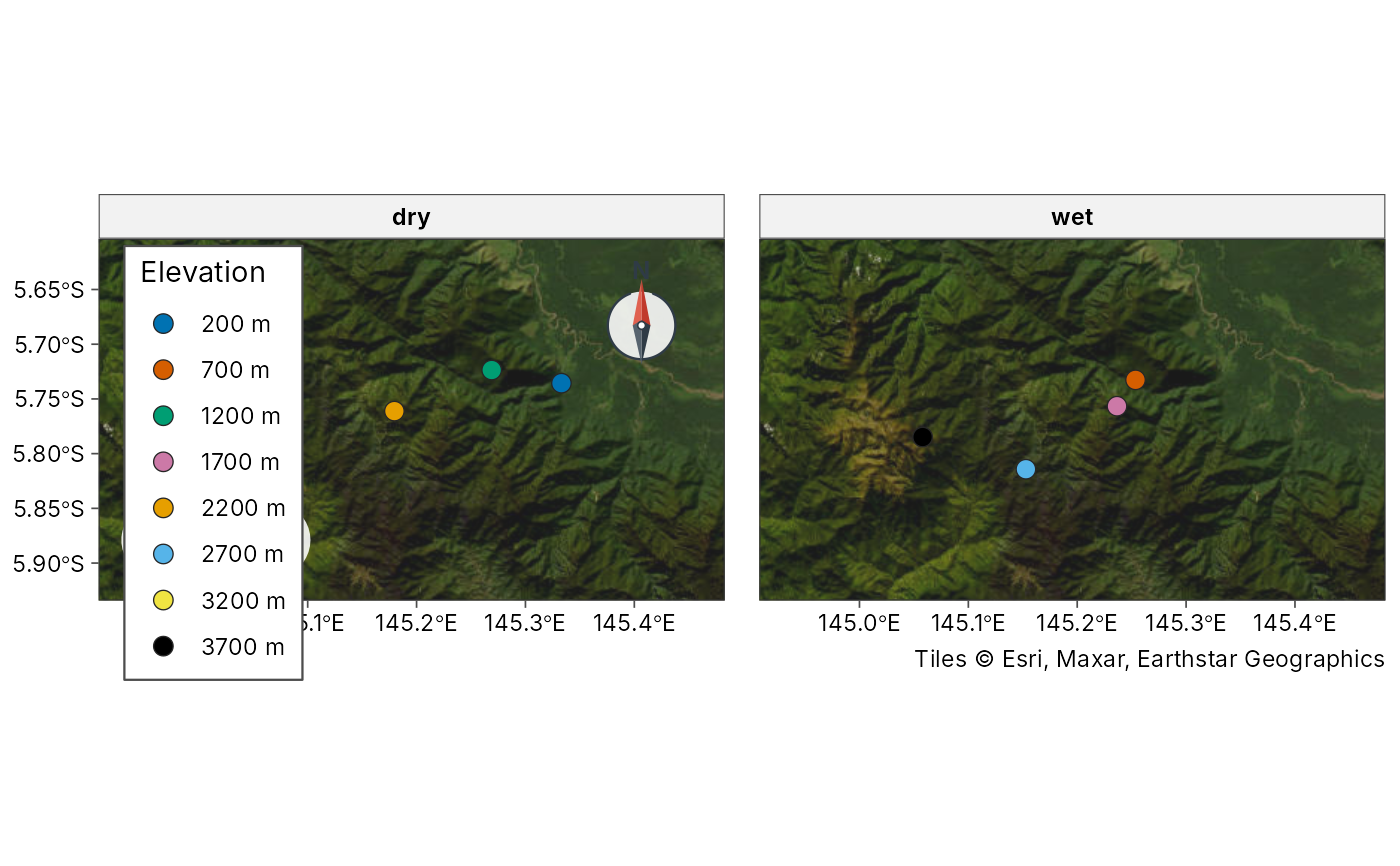
sites$season <- rep(c("dry", "wet"), length.out = nrow(sites))
plot_sites(sites, lon, lat, colour = elevation_band, facet = season)