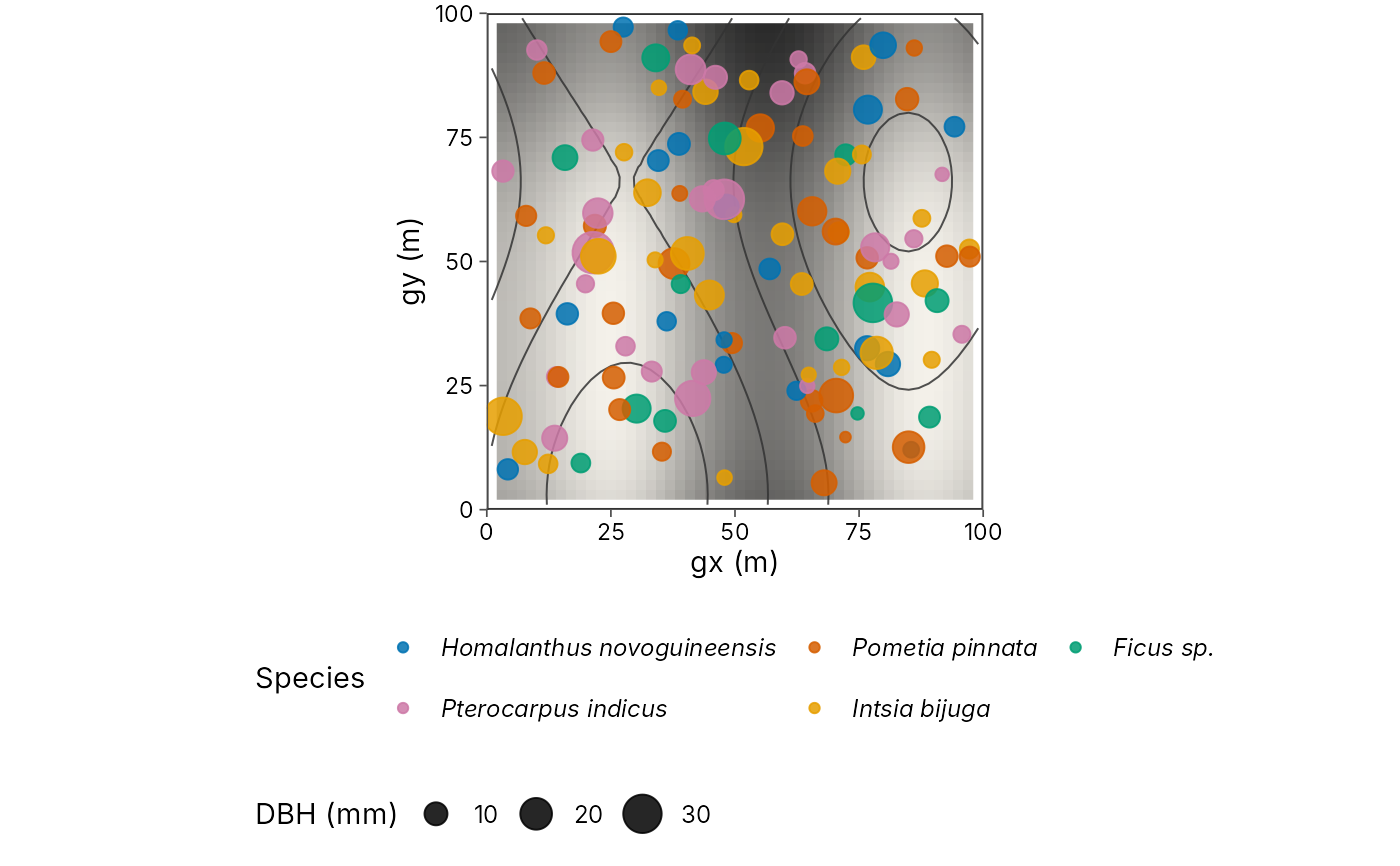
Map tree stems over topography
plot_topo.Rdplot_topo() draws individual trees or stems over a topographic backdrop
for ForestGEO-style and similar plot inventories (Wanang and other large
forest dynamics plots). Points use local projected coordinates in metres
(gx, gy) or geographic lon/lat. The backdrop can be contour lines,
a DEM / hillshade raster, or both. Colour by species or size (DBH), and
optionally draw the plot boundary.
Expected columns for a ForestGEO-like table: plot, treeID, stemID,
gx, gy (metres from the plot origin), dbh, species, status.
Geographic inventories may use lon / lat instead of gx / gy.
Pass your own stem inventory. geo_example_stems() is simulated test
data for checking code, not a real plot, so do not publish maps drawn
from it.
Usage
plot_topo(
  data,
  x = "gx",
  y = "gy",
  lon = NULL,
  lat = NULL,
  colour = NULL,
  size = NULL,
  dem = NULL,
  boundary = NULL,
  contours = TRUE,
  hillshade = TRUE,
  contour_breaks = NULL,
  basemap = "none",
  palette = c("okabe_ito", "grey"),
  point_alpha = 0.85
)
Arguments
- data
A data frame of stems/trees, or an
sfobject.- x, y
<
data-masking> Local metre columns (defaultsgx,gy). Ignored whenlon/latare set ordataissf.- lon, lat
<
data-masking> Optional geographic coordinates. When supplied, they overridex/y.- colour
<
data-masking> Grouping column (species, status) or a continuous size such as DBH.- size
<
data-masking> Optional column mapped to point size (typicallydbh). WhenNULLanddbhexists, DBH is used.- dem
Optional
terra::SpatRasterelevation surface for hillshade and/or contours. In local metre coordinates the raster should use the same origin asgx/gy.- boundary
Optional
sfpolygon of the plot boundary, or a numeric bboxc(xmin, ymin, xmax, ymax).- contours
Draw contour lines from
dem?- hillshade
Draw a hillshade backdrop from
dem?- contour_breaks
Contour interval, or a vector of breaks. When
NULL, pretty breaks are chosen.- basemap
Passed to
geo_basemap()when using lon/lat (for example"coast"). Ignored for local metre coordinates.- palette
Discrete palette when
colouris categorical.- point_alpha
Point opacity.
Examples
stems <- geo_example_stems()
dem <- geo_example_dem()
plot_topo(stems, colour = species, size = dbh, dem = dem, boundary = c(0, 0, 100, 100))